2010-03-09 9 views
6

मैं इस समय matplotlib के साथ प्रयोग कर रहा हूँ। कुछ समय पहले मैंने एक्सेल वीबीए कोड का इस्तेमाल किया ताकि छवियों को एक संलग्न किया जा सके।मैं matplotlib का उपयोग कर छात्र-शैली ग्राफ कैसे बना सकता हूं?

आपको पता चलेगा कि यह एक वैज्ञानिक/शोध शैली में प्रस्तुत नहीं किया गया है, बल्कि ग्राफ़ पेपर पर स्कूल-छात्र द्वारा उत्पादित किया गया है - तीन अलग-अलग ग्रिड-लाइन शैलियों के साथ।

क्या matplotlib के साथ इस तरह की चीज़ को प्राप्त करने के लिए एक काफी सरल तरीका है?

alt text

उत्तर

8

हाँ, आप इस के लिए spines उपयोग कर सकते हैं।

import matplotlib.pyplot as plt 
from matplotlib.ticker import MultipleLocator, FormatStrFormatter 
import numpy as np 

fig = plt.figure(1) 
ax = fig.add_subplot(111) 

# set up axis 
ax.spines['left'].set_position('zero') 
ax.spines['right'].set_color('none') 
ax.spines['bottom'].set_position('zero') 
ax.spines['top'].set_color('none') 
ax.xaxis.set_ticks_position('bottom') 
ax.yaxis.set_ticks_position('left') 

# draw curve 
x = np.arange(-2.5,2.5,0.01) 
line, = ax.plot(x, x**2) 

#set bounds 
ax.set_ybound(-1,7) 

# create grid 
#ax.xaxis.set_major_locator(MultipleLocator(1)) 
#ax.xaxis.set_minor_locator(MultipleLocator(0.2)) 
#ax.yaxis.set_major_locator(MultipleLocator(1)) 
#ax.yaxis.set_minor_locator(MultipleLocator(0.2)) 
#ax.xaxis.grid(True,'minor') 
#ax.yaxis.grid(True,'minor') 
#ax.xaxis.grid(True,'major',linewidth=2) 
#ax.yaxis.grid(True,'major',linewidth=2) 

#adjust grid on the 2s 
#for idx,loc in enumerate(ax.xaxis.get_majorticklocs()): 
    #if loc !=0 and loc % 2 == 0: ax.get_xgridlines()[idx].set_c('r') 
#for idx,loc in enumerate(ax.yaxis.get_majorticklocs()): 
    #if loc !=0 and loc % 2 == 0: ax.get_ygridlines()[idx].set_c('r') 

## THIS IS THE EDIT 
ax.xaxis.set_minor_locator(MultipleLocator(0.2)) 
ax.yaxis.set_minor_locator(MultipleLocator(0.2)) 
ax.xaxis.grid(True,'minor',linewidth=2) 
ax.yaxis.grid(True,'minor',linewidth=2) 

minor_grid_lines = [tick.gridline for tick in ax.xaxis.get_minor_ticks()] 
for idx,loc in enumerate(ax.xaxis.get_minorticklocs()): 
    if loc % 2.0 == 0: minor_grid_lines[idx].set_c('r') 
    elif loc % 1.0 == 0: minor_grid_lines[idx].set_c('g') 
    else: minor_grid_lines[idx].set_c('b') 

plt.show() 

alt text http://i42.tinypic.com/a1pcw3.png

+0

शानदार मिलेगा !!! ऐसा लगता है कि मैं क्या कर रहा था। बहुत बहुत शुक्रिया! – Geddes

+0

मेरा अंतिम प्रश्न होगा: क्या तीन अलग-अलग ग्रिड लाइन शैलियों को प्राप्त करने का कोई तरीका है? मैं * 0.2 के लिए एक शैली चाहता हूं, दूसरा * 1 के लिए और फिर 2 * के लिए दूसरा (ग्राफ-पेपर में)। यह मुश्किल लगता है क्योंकि matplotlib केवल प्रमुख/मामूली ticks लगाया प्रतीत होता है। एक बार फिर धन्यवाद! – Geddes

+0

@Geddes, उपरोक्त संपादन देखें। मुझे लगता है कि सबसे आसान तरीका सिर्फ अपनी स्थिति के आधार पर ग्रिडलाइन को समायोजित करना होगा (यानी 2 के गुणकों पर)। – Mark

1

बस एक और सोचा - मैं भी यह सब नाबालिग ग्रिडलाइनें (अलग यह मेरी समझ में मदद मिलेगी और कुछ से) के साथ करने की कोशिश की है, लेकिन यह की वजह से ठीक से गणना नहीं कर रहा है, कोई संदेह नहीं get_minorticklocs और ax.get_xgridlines। क्षमा करें, और अग्रिम धन्यवाद ...

Geddes

import matplotlib.pyplot as plt 
from matplotlib.ticker import MultipleLocator, FormatStrFormatter 
import numpy as np 

fig = plt.figure(1) 
ax = fig.add_subplot(111) 

# set up axis 
ax.spines['left'].set_position('zero') 
ax.spines['right'].set_color('none') 
ax.spines['bottom'].set_position('zero') 
ax.spines['top'].set_color('none') 
ax.xaxis.set_ticks_position('bottom') 
ax.yaxis.set_ticks_position('left') 

# draw curve 
x = np.arange(-2.5,2.5,0.01) 
line, = ax.plot(x, x**2) 

#set bounds 
ax.set_ybound(-1,7) 

# create grid 
ax.xaxis.set_minor_locator(MultipleLocator(0.2)) 
ax.yaxis.set_minor_locator(MultipleLocator(0.2)) 
ax.xaxis.grid(True,'minor',linewidth=2) 
ax.yaxis.grid(True,'minor',linewidth=2) 

#adjust grid on the 2s 
for idx,loc in enumerate(ax.xaxis.get_minorticklocs()): 
    if loc % 2 == 0: ax.get_xgridlines()[idx].set_color('r') 
    if loc % 1 == 0: ax.get_xgridlines()[idx].set_color('g') 
    if loc % 0.2 == 0: ax.get_xgridlines()[idx].set_color('b') 

for idx,loc in enumerate(ax.yaxis.get_majorticklocs()): 
    if loc % 2 == 0: ax.get_ygridlines()[idx].set_c('b') 

plt.savefig('spines3.png',dpi=300) 
+0

@Geddes टाइप करने के लिए +1, ax.get_xgridlines() केवल प्रमुख ग्रिडलाइन लौटाता है। उपरोक्त मेरे उत्तर में संपादन देखें। – Mark

+0

शानदार - आज आपकी सभी मदद के लिए आपको बहुत धन्यवाद - मुझे पता है कि मैं एक मांग करने वाला ग्राहक हूं! मेरी सभी शुभकामनाएँ, गेडेस – Geddes

0

यह स्वीकार किए जाते हैं जवाब से ऊपर का एक संशोधित संस्करण है। हो सकता है कि किसी को यह उपयोगी

import matplotlib.pyplot as plt 
from matplotlib.ticker import MultipleLocator, FormatStrFormatter 
import numpy as np 
from matplotlib.ticker import FormatStrFormatter 

_fontsize_legend = 10 
_fontsize = 15 

DP = 2 

fig = plt.figure(figsize=(12, 12), dpi=100, facecolor='w', edgecolor='k') 
##fig = plt.figure() 
fig.canvas.draw() 
ax = plt.gca() 

# set up axis 
ax.spines['left'].set_position('zero') 
ax.spines['right'].set_color('none') 
ax.spines['bottom'].set_position('zero') 
ax.spines['top'].set_color('none') 
ax.xaxis.set_ticks_position('bottom') 
ax.yaxis.set_ticks_position('left') 

# draw curve 
x = np.arange(-2.5,2.5,0.01) 
line, = ax.plot(x, x**2) 

#set bounds 
ax.set_ybound(-1,7) 

## THIS IS THE EDIT 
ax.xaxis.set_major_locator(MultipleLocator(1/4)) 
ax.yaxis.set_major_locator(MultipleLocator(1/4)) 
ax.xaxis.grid(True,'major',linewidth=2/DP,linestyle='-',color='#d7d7d7',zorder=0) 
ax.yaxis.grid(True,'major',linewidth=2/DP,linestyle='-',color='#d7d7d7') 

ax.xaxis.set_minor_locator(MultipleLocator((1/4)/5)) 
ax.yaxis.set_minor_locator(MultipleLocator((1/4)/5)) 
ax.xaxis.grid(True,'minor',linewidth=0.5/DP,linestyle='-',color='#d7d7d7') 
ax.yaxis.grid(True,'minor',linewidth=0.5/DP,linestyle='-',color='#d7d7d7') 

ax.set_axisbelow(True) 
ax.set_aspect('equal') 

##ax.axhline(linewidth=0) 
##ax.axvline(linewidth=0) 

ax.xaxis.set_major_formatter(FormatStrFormatter('%i')) 
xticks = ax.xaxis.get_major_ticks() 
for i,l in enumerate(xticks): 
    if not (i - 1) % 4 == 0: 
     xticks[i].label1.set_visible(False) 
    else: 
     xticks[i].label1.set_fontsize(_fontsize) 

ax.yaxis.set_major_formatter(FormatStrFormatter('%i')) 
yticks = ax.yaxis.get_major_ticks() 
for i,l in enumerate(yticks): 
    if not (i - 1) % 4 == 0: 
     yticks[i].label1.set_visible(False) 
    else: 
     yticks[i].label1.set_fontsize(_fontsize)  

figManager = plt.get_current_fig_manager() 
figManager.window.showMaximized() 
plt.show() 

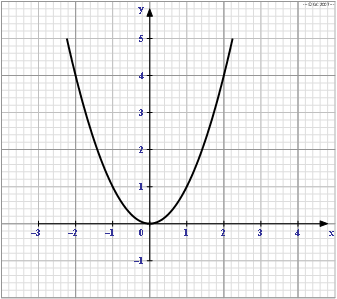
This is how this sample looks [picture]

संबंधित मुद्दे